Help:Contributing/diagrams: Difference between revisions
Show where the renderer attribute goes: without/with source example (attribute line highlighted) + keep the 7-engine overview (via update-page on MediaWiki MCP Server) |
|||
| Line 50: | Line 50: | ||
== GraphViz == | == GraphViz == | ||
<syntaxhighlight lang="wikitext" copy><graphviz> | <syntaxhighlight lang="wikitext" copy><graphviz renderer="dot"> | ||
digraph g { A -> B -> C } | digraph g { A -> B -> C } | ||
</graphviz></syntaxhighlight> | </graphviz></syntaxhighlight> | ||
| Line 58: | Line 58: | ||
</graphviz> | </graphviz> | ||
Different renderer engines provide different layouts: | |||
{| class="wikitable" | {| class="wikitable" | ||
|- | |- | ||
! | ! Renderer !! Rendered graph | ||
|- | |- | ||
| <syntaxhighlight lang="wikitext" inline>dot</syntaxhighlight> (default if "renderer" omitted) || <graphviz> | |||
| <syntaxhighlight lang="wikitext" inline>dot</syntaxhighlight> (default) || <graphviz> | |||
digraph g { A -> B -> C } | digraph g { A -> B -> C } | ||
</graphviz> | </graphviz> | ||
Revision as of 17:08, 24 August 2026
Diagrams are written in the page text and render automatically when the page is viewed — no external tool, no exporting and re-uploading an image. Editing a diagram is editing the page itself.
| Tag | What it renders | Where it renders |
|---|---|---|
<uml> |
PlantUML (sequence, class, state, activity, component, …) | server-side, cached image |
<graphviz> |
GraphViz (dot, neato, fdp, sfdp, circo, twopi, osage) | server-side, cached image |
<mscgen> |
Message sequence charts | server-side, cached image |
<mermaid> |
Mermaid (flowchart, sequence, ER, Gantt, …) | in your browser |
PlantUML
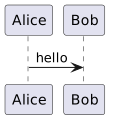
Write the diagram body directly, with type="uml":
<uml type="uml">
Alice -> Bob: hello
</uml>
Result:
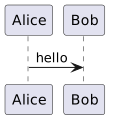
You can also write the usual @startuml/@enduml directives (both forms work):
<uml>
@startuml
Alice -> Bob: hello
@enduml
</uml>
The bundled PlantUML stdlib is available (!include <C4/C4_Context> and friends).
PlantUML runs in its SANDBOX security profile on this instance:
!includeof local files and URLs is disabled. Diagrams must be self-contained (except the bundled stdlib).
GraphViz
<graphviz renderer="dot">
digraph g { A -> B -> C }
</graphviz>
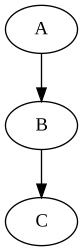
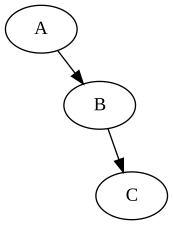
Different renderer engines provide different layouts:
| Renderer | Rendered graph |
|---|---|
dot (default if "renderer" omitted) |
|
neato |
 |
fdp |
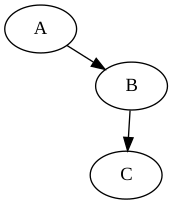 |
sfdp |
 |
circo |
 |
twopi |
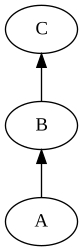 |
osage |
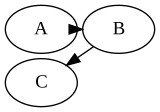 |
Mscgen
<mscgen>
msc { A, B; A -> B [ label="hello" ]; }
</mscgen>

Mermaid
<mermaid>
graph LR
  A --> B
</mermaid>
Mermaid renders in your browser (JavaScript): the diagram is empty in printed/static export. Use other options above for print-friendly diagrams.
Output format
The default output is SVG (crisp, small). Force PNG per diagram with format="png":
<uml type="uml" format="png">
Alice -> Bob: hello
</uml>
See also
- Help:Contributing — contributing to this wiki
- Help:Contributing/math — LaTeX + KaTeX math
- Help:Contributing/code — code blocks and syntax highlighting